A Quick Overview of Poloniex Market Interface
Poloniex is one of the most popular cryptocurrency exchanges today. It has average volume of 190,000BTC daily with almost 40,000 online users at all times.
We will take the LTC market as a reference for the explaination.
The Price

Starting at the top, You can see the last price of the coin(Last Price), the percentage price change in the price of the coin(24 Hour Change), the highest price of the coin in the last 24 hours(24 Hour High) and the lowest price of the coin in the last 24 hours(24 Hour Low). Below this is the volume of the coin that was traded in the last 24 Hours displayed in both the BTC and the coin market you are in.
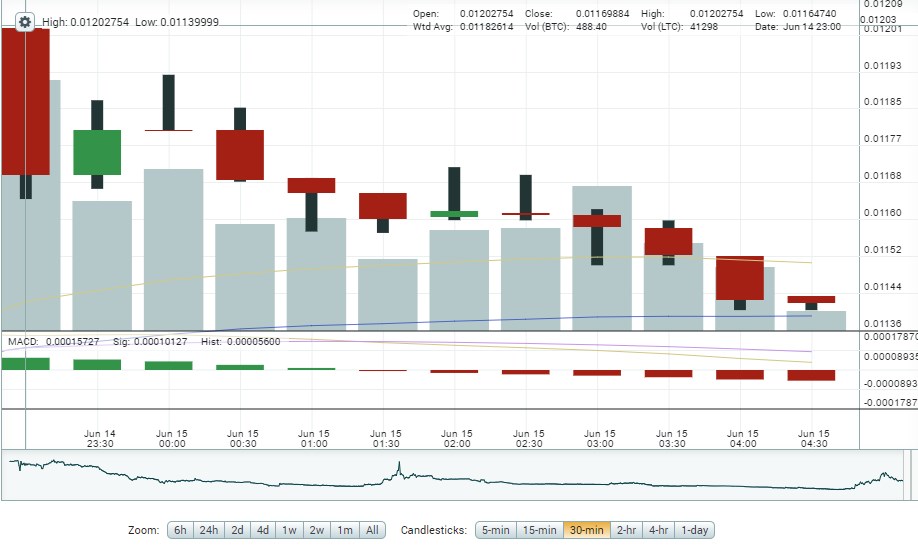
Price Chart

The first chart displays the price with relation to the time. The green lines indicate the increase in the price and the red lines indicates the decrease in the price in that time period. Below the chart are the options zoom and candlesticks. The zoom option sets the period of time you want to view the chart for. The candlestick option sets the interval for the price change. If you set the zoom level to 6h and candlestick to 4 hours, you will only see one big block of green or red section in the chart. If you set zoom to all and candlestick to 5 min, you will see the most number of green and red lines in the chart.
Buy Sell Section

The next section is for buying and selling the coin. The buy section has three option: the price of the coin, amount of coin you want to buy and the total in btc. The sell section has three same options as well. In the middle section, there is a option to place stop-limit orders. There is dedicated page on poloniex explaining the stop limit order section.
Order Books

Below the buy sell section are the order books. These order books display the outstanding orders that are ready to be filled. The sell orders display the orders of the people that want to sell their coins for bitcoin and the buy orders display the orders of the people that want to buy that coin for bitcoin.
The order book has 4 columns:
Price: The price at which the person wants to buy or sell the coin
Coin Name: The amount of coin available at that price
BTC: The btc value of that order
Sum(BTC): The amount of bitcoin needed to reach that order.
Market Depth

The market depth chart displays the relation of the amount of coin with respect to the price of the coin according to the order books. The green section displays the buy orders and the red section displays the sell orders. The more the vertical the line is, the more the coins are at that point. Horizontal line means low amount of coins at that price. The distance between green and red section represent the spread between the buy and the sell price.
Trade History

The trade history displays the history of the trades in real time. It has 5 columns. The date displays the date and time of the trade, the type displays the type of the trade, Price(BTC) displays the rate at which the coins were sold or bought, Amount(coin) displays the amount of coins sold or bought and Total(BTC) displays the btc value of the order.


